To access the reports of your survey, just click the pie icon
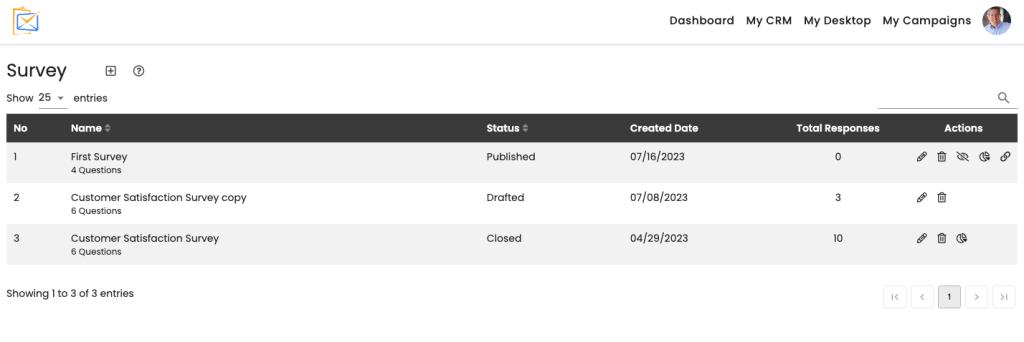
The first tab, Demographic, we display a pie chart of the locaation the survey was answered
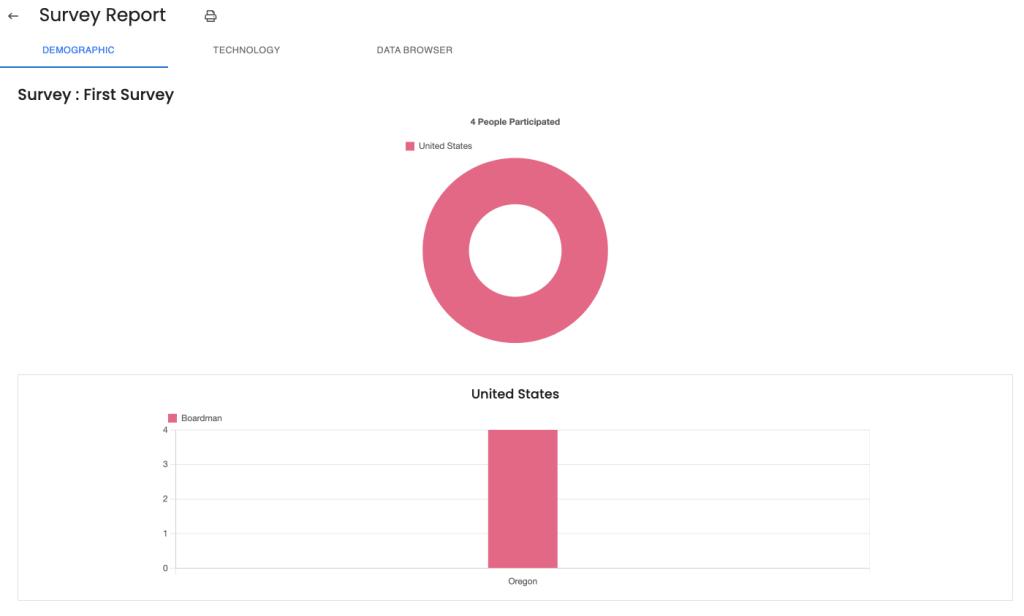
The next tab Technology will display the platform that were used to answer the Survey.
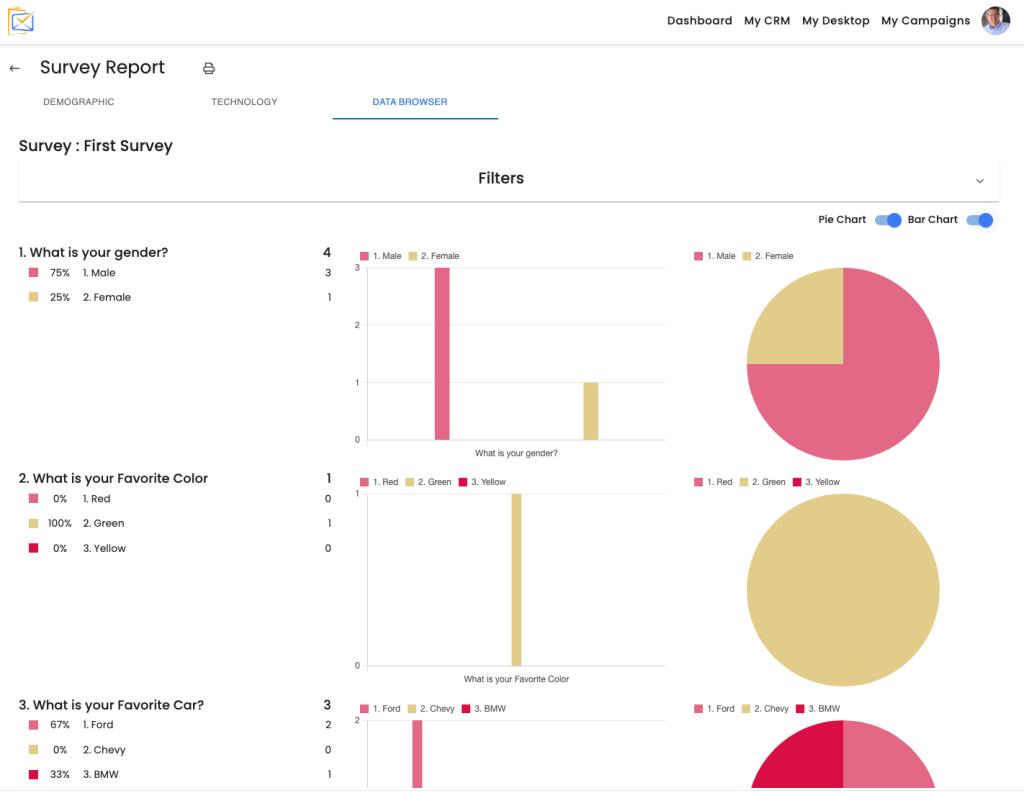
The next tab Data Browser is a very powerful feature and let your drill down into your Reports. From the Data Browser you can select the type of graphs you would like to display.
You can also drill down and get context by click the Filter link. The drill down allows you have an employee survey that can report at the Company, Organization and Manager level so each group gets their own results. It is also ideal for Sports Teams who want to report on the Organization, team coach level, or it can be used with your demographic questions to get powerful insights to how people feel
You can also generate a PDF anytime you want to print the results or share your results! Make sure you enable pop up on your browser.